Archive for October, 2017

How do people use the Portal Data?

October 27, 2017

Every so often, someone asks me for a Portal reading list to come up to speed on what we know about the site. This seems like a simple questions, but it is actually pretty difficult. We define a “Portal Paper” as a paper using data collected at the study site (whether or not Portal Project people were involved), or data collected near the study site if that data was collected by the project or with substantive assistance from our project. Over the years, the site has contributed to over 120 papers and book chapters (our current estimate is 123, but we still find older papers that we didn’t know existed).

How the Portal Data is used has been changing in recent years. Historically, most papers were by people affiliated with the group. As we’ve blogged about before, starting in 2009 we have been working on making our data openly available through  number of venues. We post all of our data on the Portal GitHub Repo and we have also published two Data Papers through Ecology’s Ecological Archives. The nice thing about Data Papers is that they are indexed and cited just like regular scholarly papers, which is important because it allows us to 1)  document that the Portal Project is a valuable scientific resource to the community (which theoretically may be helpful on grant applications) and 2) let us here at the Portal Project keep informed of results coming out of the site that we’re not involved in.  So, how are scientists, external to our group, using our openly available data? Google Scholar lists 22 citations between the 2 data papers. (For the non-academics, citing other papers is in our own papers is an important part of scientific publishing. It allows us to give credit to those whose ideas, data, or methods we are working with. It also allows to us provide proof or support that statements we make in our papers are supported by things other people have been finding. Google Scholar is a database that keeps track of these citations). Here’s the breakdown of what Google Scholar says has been citing our Data Papers:

RplotAll the site focused research (papers that use our data as the primary focus of their analysis) was done by  or in collaboration with someone affiliated with the project. If other researchers are using our data, so far they tend to either use it as part of a meta-analysis (i.e. as one of many data points in the analysis) or to make a figure for their statistical or conceptual paper that has an empirical example of what they are talking about. (Three papers cite a Data Paper for reasons that defy classification. After reading their paper I have no idea why they cited us)! This number of citations listed by Google Scholar is probably a little lower than the database’s actual use in papers because data citations for meta-analyses often get shoved off into the supplementary materials and are not indexed by Google Scholar as a result. Our usage in meta-analyses is probably higher, but it is unlikely that we’ve missed a paper focused solely on data from our site.

We are hoping to increase Portal’s usability and we have some things in the works, which we will blog about later, that we hope will make it easier for people to get the data they need to use Portal as part of their analyses. We love seeing the data used but know that the history of the site and all the manipulation changes can make it difficult to figure out how to extract the data you need.


The Portal Weather Station

October 20, 2017

For the history of the project, weather monitoring has always accompanied the collection of rodent, plant, and ant data. At first, this was done manually. Portalites from 1980 to 1989 measured rain in a rain gauge, and used something called a hygrothermograph to measure temperature and humidity.

hygrothermograph

Hygrothermograph

Then things started to get fancy. In 1989, an automated weather station was installed. This is the desert though, and leaving expensive toys out in the rain, dust and lightning takes it’s toll.

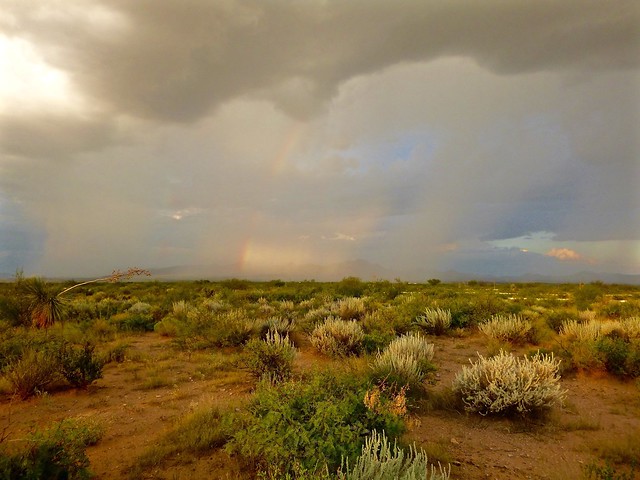
Sunset in the desert jungle

At least the lightning storms leave us with some nice scenery after they try to blow up our weather station.

All things considered, our weather stations have stood up pretty well. The first lasted from 1989 until 2002. And the station from 2002 is still limping along, although it’s had its moments (it tends to have a bit of a tantrum after being struck by lightning). We connected to the dataloggers for those stations directly. That is, as part of their monthly duties, the rodent RA has to connect to the datalogger, download the data, and bring it back to the lab for checking and appending to the database.

Anticipating the 2002 station’s impending demise, in August 2016 we upgraded to a new station, and took the opportunity to make some improvements.

2016 station

The majestic new station

Of course we continue to collect data on precipitation, temperature and humidity. But we’ve also gotten to add a wind sensor (wind speed and direction), pyranometer (solar radiation), and barometer (atmospheric pressure). Having these additional data means that we can also calculate things like evapotranspiration, sunshine hours, and windchill. We have also added a new program to collect fine-scale precipitation data during storms. When a precipitation event begins, the datalogger begins recording total precipitation every 5 minutes until the storm ends.

The addition of a cellular modem is another major improvement. Rather than downloading it monthly in the field, we access the data remotely. The data trickle in to  our data repo whenever edits are made to trigger a new build, or at least once a week, and quality control happens automatically. Our station has a Wunderground account (from whence the fancy little widget in the sidebar comes). And we’ve mounted the phenocam (featured in an earlier post, and another widget in the sidebar) to it.

Aside from just being darn cool, the upgrades have improved our data collection. We can see what the weather has been at our exact location at any time. That means we can know what to expect from the plants before we go for a census (as much as that’s possible). And we can communicate with the datalogger at anytime. If something is wrong with the weather station, we’ll know immediately. It may be possible to fix the problem remotely. If not, the rodent RA can plan to fix it while she’s down there, instead of discovering the problem at the site, waiting until the next month to fix it, and losing at least a month worth of data. And we can always send new programs to the datalogger, if we want to add new data tables make improvements.

Find our weather data, updated sub-weekly, on the Portal Data github repository.

A Vegetation History

October 11, 2017

My Portal story begins in 1991 when Jim Brown offered me the opportunity to be the Portal postdoc. Among other things, this meant I organized the yearly ant census in which we spent about 2 weeks counting the abundance of ant colonies on the experimental plots. In one of my first summers, I hired Don Sias to help with the census. Don was a non-traditional student and had previously traveled extensively throughout the southwest. One day he mentioned to me that the vegetation in the San Simon valley looked pretty “beat up”. By that he meant the vegetation, dominated by shrubs, had the look of a grassland that had become desertified.

August 2015

I was intrigued by Don’s comment for two reasons. First, Brown and Heske (1990) had recently described a significant increase in grass cover on Portal plots that removed kangaroo rats and mentioned that the site was “near the zone of natural transition from desert to grassland”. Second, while desertification is often associated with overgrazing, Heske and Campbell (1991) found no difference in vegetation across the Portal grazing fence despite 11 years of livestock removal – why hadn’t the grasses recovered with livestock removal if the site had once been a grassland?

When I returned to Albuquerque, I recall asking Jim about the vegetation history of the site. He said that he wasn’t sure and encouraged me to see what I could figure out. That led me to the U.S. General Land Office Surveyors notes. The surveyors described the dominant vegetation they traveled through as each mile-long section line was surveyed. Many, but not all, of the lines near our site were surveyed between 1875 and 1883 and the most common description was “good grass”. However, when the surveyors came back to complete their work in the early part of the 20th century, the descriptions were dominated by the words “scattered shrubs” while grass was not mentioned at all. This change in vegetation coincided with large introductions of livestock into the San Simon valley in the late 1880’s, and then a major drought in the early 1890’s that resulted in tremendous livestock mortality due to starvation.

Our understanding of the recent vegetation change at the site can help to explain the observed shifts in grass cover observed at Portal both over time and across the rodent treatments. It also prompted further investigations into desertification and the role of livestock in affecting soil compaction as a mechanism that helps to explain why reversals of desertification (a recovery of perennial grasses) can require several decades. Finally, it illustrates how careful observations by students and researchers that visit the site can lead to interesting questions and new discoveries.

This slideshow requires JavaScript.

I’ve been very fortunate to have worked on the Portal system for almost 30 years. Change seems to be the constant at Portal – you never know what you’ll see and how things have changed since the last visit. This complex system continues to be a source of inspiration as we try to understand it (or, as Morgan says, “unravel her mysteries”).

Portal: Then and Now

October 4, 2017

A lot can change in 40 years.  This is perhaps never more apparent than when you find a box of old photographs, and start comparing then to now.  When the Weecology lab immigrated from Utah to Florida in 2015, just such a box surfaced: a glimpse back in time to the beginning of the portal project.  I did my best to re-create some of these photographs—trying to line up horizons and mountains—to show how the site has changed over 40 years.

One thing is immediately apparent: the shrubs have grown up.  The left side of these photographs were taken in 1977 (photographer unknown), and the right side in 2015 (photographer Erica Christensen).  What happened to the rows upon rows of aluminum flashing, indicating the location of the rodent fences?  I assure you the fences are still there, they’re just obscured by the jungle.

This slideshow requires JavaScript.

The fact that you used to be able to see clear across the site is shocking to the modern research assistants. These days, part of the training for new RAs taking over work at Portal is receiving a map from the previous RA with routes drawn in for the best paths between plots. Navigation is not trivial.

8026709349_282056039c_o

Erica, circa 2012, demonstrating the problem (photographer Sarah Supp)

Other locations at the site don’t look too different from how they looked in the ‘70s. Grass cover comes and goes depending on the strength and timing of monsoon rains every year, but some plots don’t seem as affected as others by the shrub explosion.

This slideshow requires JavaScript.

While shrub encroachment is an annoying obstacle to a human, it is a major ecological shift to a rodent. This was the topic of a 1997 paper by Brown, Valone, and Curtin, where they found a 3-fold increase in shrub cover between 1980 and 1995 by analyzing historical aerial photographs. The authors also noted a concurrent decline in rodent species affiliated with arid grassland (banner-tail kangaroo rat and silky pocket mouse) and an increase in species affiliated with arid shrubland (desert pocket mouse and Bailey’s pocket mouse). It looked like the grassland species were on their way out and the shrubland species were taking over. However banner-tails and silkys continue to be found at the site, despite the fact that shrub cover has increased, if anything, since 1995. They’re now quite rare; these days we pretty much only see them when the rains align just right to give us a “grassy year.”

flavus2

Nobody tell this adorable silky pocket mouse we’re a shrub habitat now

Those of us who have worked at Portal know that things are always different every time you go down, and yet some things never change. Which is why we keep going, keep collecting data: even after 40 years there is still a lot to learn.

Reference:
Brown, J.H., Valone, T.J., and Curtin, C.G. (1997). Reorganization of an arid ecosystem in response to recent climate change. Proc. Natl. Acad. Sci. 94, 9729–9733.