Author Archive

Community change: fast or slow?

January 7, 2018

In a previous post, I talked about a major trend over time at the Portal site: the slow and steady increase in shrub cover, which has gradually replaced the grassy landscapes of the 1970s. I also mentioned that this was accompanied by changes in the rodent species we caught: in the 1970s and 80s when shrub cover was still low, we found more individuals of grassland-loving species, whereas in recent years we see more individuals of shrub-loving species now that shrub cover is high. This seems like a straightforward story—species that love shrubs will become more abundant as shrubs cover more of the landscape—but it turns out there’s more to it. In this post, I’m going to describe how three pieces of evidence led me to questions about the dynamics of community change over time, and the new method I used to quantify it.

Evidence #1: the gradual increase in shrub cover + the change in species composition of the rodent community. Shrub cover has increased at least 3-fold since the time the Portal Project was established in 1977. Published studies have also noted that rodent species typical of arid grasslands have declined during that time (such as the banner tail kangaroo rat Dipodomys spectabilis and silky pocket mouse Perognathus flavus), while rodent species typical of arid shrubland have increased their populations (such as Merriam’s kangaroo rat Dipodomys merriami and desert pocket mouse Chaetodipus penicillatus). The obvious prediction is that the change in rodent species was caused by the change in shrub cover: however, so far all we have is a correlation, we would need more information to infer causation.

This slideshow requires JavaScript.

Evidence #2: the high mortality of rodents that occurred after a dramatic sheet flood swept through the Portal Project, during the monsoon season of August 1999. This is illustrated by the graph below, showing the relatively stable number of rodents at the site over the year and a half leading up to the storm, followed by their sharp decline.

Flood decline

Total rodent capture numbers over time: showing sharp decline after a flood in August 1999

Evidence #3: Populations quickly bounced back after the sheet flood of 1999—but things were different. Within two months, researchers were catching numbers of rodents comparable to those before the flood. However, the community of rodents that re-assembled after the flood was not the same community that had existed before. While the identity of species present remained approximately the same, the relative abundances of these species changed drastically. Most notably, two species of pocket mice which had been rare up to this time (desert pocket mouse and Bailey’s pocket mouse, Chaetodipus penicillatus and C. baileyi respectively), rapidly increased their populations to become numerical dominants in the community. (Details of the flood and its effects can be found in Thibault and Brown (2008)).

The first chapter of my dissertation explores how these three pieces of evidence–an increase in shrub cover, an extreme weather event, and a shift in rodent community structure–are connected. Piecing these together, we have slow change in habitat that we believe is impacting the rodent community, a disturbance that proved catastrophic for the rodents at Portal, and a dramatic change in community structure. How can we put these together to describe the dynamics of this rodent community overall?

Did the transition from grass-loving to shrub-loving rodent communities occur slowly, following the slow change in habitat, or in a series of quick bursts (one of which happened in August 1999)? This is an important distinction to make, because it provides information about the mechanisms behind community change. If the rodent community is changing slowly with habitat change, this indicates that habitat is driving rodent community change.

However, if change occurs in quick bursts instead, it implies that habitat change is not the most important driver, and perhaps some sort of trigger is needed to facilitate change (like a flood). Furthermore, if we want to predict how this community (and others) will change in the future, we need to know when/if change tends to happen slowly vs. quickly. These concepts apply not only to the rodents at Portal, but to broad questions about community structure for many taxa.

The Research Question: is change in the Portal rodent community slow or fast? The graph below shows examples of patterns I might see in the rodent data if the community has been changing gradually, compared to changing through a series of quick bursts. Unfortunately, measuring how populations of 21 rodent species have changed over a span of 40 years, and in relation to one another, is not easy.

Dynamics

Gradual, or discrete?

The Method: On a suggestion from my colleague Dave Harris, I decided to borrow a technique from the field of document analysis, called Latent Dirichlet Allocation (LDA for short). Document analysts use LDA to look for patterns of words within documents. The algorithm identifies words that tend to be found together in a document (and the relative proportions of those words), and infers “topics” from those patterns. Each document can then be described in terms of the “topics” it represents. I co-opted this method to analyze patterns of species within sampling events. Given a table of counts of my 21 species captured in each sampling event (436 events in my case), LDA returns an estimate of which species are found together in specific proportions. I called these community-types instead of the “topics” used in document analysis. LDA then estimates how each sampling event is partitioned into these community-types. The result is that instead of describing each sampling event by listing how many of each of the 21 rodent species were caught, we can describe it in terms of a small number of community-types. For example, one of our samples might be that in January of 2015 we captured 35 Merriam’s kangaroo rats, 1 pack rat, 6 desert pocket mice, 6 Bailey’s pocket mice, 5 grasshopper mice, and 12 cactus mice. After running this data point (with all 435 other data points) through LDA, this information is transformed to say that the collection of animals caught in January 2015 was 80% similar to community-type 1 and 20% similar to community-type 2. (For a much more thorough description of the LDA method applied to ecological data, see Valle et al 2014).

The crucial part for answering my question: I am interested in measuring dynamics over time, so the part of the LDA results I am interested in is the description of each sampling event in terms of the community-types. The results of my LDA analysis indicated that the Portal rodent data set is best described with four community-types. In the graph below, I plotted the prevalence of these four community-types at each sampling event, illustrated with four different colors. When a color has a value near 1.00 (along the vertical, y-axis), for example as the “light blue” community does near the beginning (left) of the time series (x-axis), it means the rodent community captured at those sampling times was very similar to the community-type represented by that color.

LDA results

Results of LDA analysis. Four colors represent four community-types.

Description of the results: The first thing that jumps out is that the four rodent community-types display different dynamics at different times. There are periods where the dynamics appear to be stable: for example the light blue community-type remains close to 1.0 from approximately 1977-1984, and the dark blue community-type is likewise close to 1.0 from 1990-1999. The dynamics from 2000-2010 are complicated: dark blue, gold, and gray community-types take turns as the most prominent community-type at different times (remember that the value on the y-axis represents how similar the rodent sample was to the given community-type at that time). Starting in 2010 there is a strong seasonal signal in the dynamics: the dark blue community-type is close to 1.0 during winters, and the gray community-type is close to 1.0 during summers.

Interpretation: The prediction I mentioned earlier, that change in the rodent community from one type to another might be gradual and in line with the gradual change in habitat from 1977-present, is not supported by our LDA analysis. Some sections of the time series seem to show gradual, linear change, but not the entire time series overall. Second, there are moments when there seems to be a rapid change from one community-type to another. For example, in the 1990s the rodent community samples were most similar to the dark blue community-type, until late 1999 when it was replaced by the gold and gray community-types. This fits with the evidence from Thibault and Brown 2008: the catastrophic flood in August 1999 that triggered an overhaul of the rodent community.

What’s next: This analysis hasn’t answered all the questions about how the rodent community at the Portal Project has changed over 40 years. But it’s a starting point, a big-picture view that we can use to identify different types of dynamics occurring at different times, and start to dig deeper into the causes of these dynamics. We know that communities and ecosystems all over the world are currently changing; understanding the factors that might be driving these changes is a huge step toward being able to predict and even manage future change, and the Portal Project is an example of how long-term studies with a lot of data can be used to explore these questions.

For more information: My paper describing the LDA analysis in full is available online as a preprint: “Long-term community change through multiple rapid transitions in a desert rodent community” at https://doi.org/10.1101/163931

Special thanks to Joan Meiners for editing help on this post.

Literature cited:
Thibault, K.M., and J.H. Brown. (2008). Impact of an extreme climatic event on community assembly. Proceedings of the National Academy of Sciences 105, 3410–3415.

Valle, D., B. Baiser, C.W. Woodall, and R. Chazdon. (2014). Decomposing biodiversity data using the Latent Dirichlet Allocation model, a probabilistic multivariate statistical method. Ecology Letters 17, 1591–1601.

Portal: Then and Now

October 4, 2017

A lot can change in 40 years.  This is perhaps never more apparent than when you find a box of old photographs, and start comparing then to now.  When the Weecology lab immigrated from Utah to Florida in 2015, just such a box surfaced: a glimpse back in time to the beginning of the portal project.  I did my best to re-create some of these photographs—trying to line up horizons and mountains—to show how the site has changed over 40 years.

One thing is immediately apparent: the shrubs have grown up.  The left side of these photographs were taken in 1977 (photographer unknown), and the right side in 2015 (photographer Erica Christensen).  What happened to the rows upon rows of aluminum flashing, indicating the location of the rodent fences?  I assure you the fences are still there, they’re just obscured by the jungle.

This slideshow requires JavaScript.

The fact that you used to be able to see clear across the site is shocking to the modern research assistants. These days, part of the training for new RAs taking over work at Portal is receiving a map from the previous RA with routes drawn in for the best paths between plots. Navigation is not trivial.

8026709349_282056039c_o

Erica, circa 2012, demonstrating the problem (photographer Sarah Supp)

Other locations at the site don’t look too different from how they looked in the ‘70s. Grass cover comes and goes depending on the strength and timing of monsoon rains every year, but some plots don’t seem as affected as others by the shrub explosion.

This slideshow requires JavaScript.

While shrub encroachment is an annoying obstacle to a human, it is a major ecological shift to a rodent. This was the topic of a 1997 paper by Brown, Valone, and Curtin, where they found a 3-fold increase in shrub cover between 1980 and 1995 by analyzing historical aerial photographs. The authors also noted a concurrent decline in rodent species affiliated with arid grassland (banner-tail kangaroo rat and silky pocket mouse) and an increase in species affiliated with arid shrubland (desert pocket mouse and Bailey’s pocket mouse). It looked like the grassland species were on their way out and the shrubland species were taking over. However banner-tails and silkys continue to be found at the site, despite the fact that shrub cover has increased, if anything, since 1995. They’re now quite rare; these days we pretty much only see them when the rains align just right to give us a “grassy year.”

flavus2

Nobody tell this adorable silky pocket mouse we’re a shrub habitat now

Those of us who have worked at Portal know that things are always different every time you go down, and yet some things never change. Which is why we keep going, keep collecting data: even after 40 years there is still a lot to learn.

Reference:
Brown, J.H., Valone, T.J., and Curtin, C.G. (1997). Reorganization of an arid ecosystem in response to recent climate change. Proc. Natl. Acad. Sci. 94, 9729–9733.

Monsoon Season

August 15, 2014

OLYMPUS DIGITAL CAMERA

Rainy season has arrived in Portal, AZ.  For those who are unfamiliar with the area, the majority of the year’s precipitation in the Chihuahuan Desert comes in July-August, also referred to as monsoon season.  Instead of the steady, prolonged rains that the word monsoon usually calls to mind, the Arizona version consists of relatively short but intense storms interspersed with periods of blue sky.  These storms also tend to be highly localized: you may watch the rain coming at you down the valley all morning, only to have it skirt around you to the west and miss you completely.  See http://www.wrh.noaa.gov/twc/monsoon/monsoon_NA.php for more information on the North American Monsoon. 

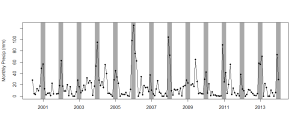
So far this year the Portal experimental site seems to be sustaining more hits than misses, and it’s shaping up to be a fairly “good” rainy season.  To see how the current season is measuring up to recent years, I’ve plotted total monthly precipitation through time in the figure below, with monsoon seasons highlighted as grey bands.  July 2014 was the 5th rainiest month in the past 14 years, exceeded only by the rainy seasons of 2004, 2006, 2008, and 2011.  And we still have August to look forward to! 

Time series of precipitation at Portal

Time series of precipitation at Portal

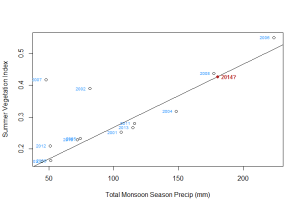
So what will this mean for our study?  One may predict that a pulse of precipitation in a moisture-poor ecosystem should cause an increase in plant growth.  Indeed, we have found evidence that the rainy season is correlated to a peak in vegetation, and that more precipitation generally means higher peaks. The following plot shows this (approximately) linear relationship between summer precipitation and summer vegetation.  The astute observer may notice that 2002 and 2007 managed to reach high levels of plant activity with low levels of precipitation.  I would first like to note that the site’s weather station was not operational during 2002 and so precipitation during this time was estimated using data from a nearby weather station which, due to the patchiness of storms mentioned above, may not be a valid estimation.  For 2007 I have no such excuse; either there are anomalies in the vegetation dataset I’m using (which is satellite-derived Normalized Difference Vegetation Index), or the rain-plant relationship is somewhat more complicated than I’ve assumed.  For the present season, if it keeps raining at the same rate we’ve seen so far, we will get about 180mm in total, putting my prediction of vegetation index at 0.42-0.43.  We’ll see how this pans out in another month or two. 

Precipitation vs. Vegetation linear regression

Precipitation vs. Vegetation linear regression

The response of the rodent community to rainy season is much more difficult to observe than the plant response.  The plant activity inspired by rainy season provides a surplus of food to the rodents, which encourages reproduction and should result in an increase in rodent abundance.  However, current research suggests that short-term weather events have little to do with rodent population dynamics, that models must incorporate weather patterns from the past year or more to detect subsequent changes in rodent abundance.  For example, numbers are not likely to increase after a single “good” summer monsoon, but they may if the site experiences a wet winter followed by a wet summer or two wet summers in a row. 

Researcher and researchee enduring inclement weather

Researcher and researchee enduring inclement weather

I want to conclude by thanking local contractor Bob Walton for the beautiful new roof on our ramada.  Just in time to keep our heads dry during this past sampling weekend! 

OLYMPUS DIGITAL CAMERA

Spring 2014 Plant Census

April 23, 2014

portal0314

Last month brought members of the weecology group (Dr. Morgan Ernest, recent graduates Dr. Glenda Yenni and Dr. Sarah Supp, and current graduate student Erica Christensen) back to Portal for the (approximately) semi-annual plant census.  Winter rains had provided us with a decent selection of annual plants to count and identify, which was a welcome contrast to the sparse plant census in spring 2013.  The breakout stars this year were smallflowered milkvetch (Astragalus nuttallianus), which showed up hundreds-strong in some quadrats, Esteve’s pincushion (Chaenactis stevioides), and the invasive redstem stork’s bill (Erodium cicutarium).  One of the most striking desert flowers found in the area, the California poppy (Eschscholzia  californica Mexicana), was also present on many plots.

Eschscholzia  californica Mexicana

Eschscholzia californica Mexicana

In total, we identified 28 annual plant species, a marked improvement from the 16 species recorded in the spring census of 2013 and quite similar to the 30 species recorded in 2012.  However while species composition was similar in years 2012 and 2014, plant abundances were much lower in 2014.  This is likely due in part to differences in total winter precipitation; precipitation was high in 2012, very low in 2013, and somewhere in the middle in 2014.

Abundances of the top 10 species for the past 3 years: Astragalus nuttallianus, Erodium cicutarium, Chaenactis stevioides, Lesquerella gordoni, Descurainia pinnata, Phacelia arizonica, Linanthus bigelovii, Eschscholzia californica mexicana, Eriastrum diffusum, Lepidium lasiocarpum

Abundances of the top 10 species for the past 3 years: Astragalus nuttallianus, Erodium cicutarium, Chaenactis stevioides, Lesquerella gordoni, Descurainia pinnata, Phacelia arizonica, Linanthus bigelovii, Eschscholzia californica mexicana, Eriastrum diffusum, Lepidium lasiocarpum

We also used the trip to perform some much-needed maintenance on the site.  The low fences around each of our 24 experimental plots require frequent upkeep to prevent the rodents from tunneling under or climbing over them, but there is also a barbed wire cattle fence around the perimeter of the 20 ha site that has gotten very little care in the past decade or so.  It only came to my attention in March, when I was surprised to find a very large herbivore chewing his cud on my study site.  We were able to chase him off with minimal damage (either physical or emotional) to man and beast, but the experience inspired me to request the help of my PhD adviser in repairing some conspicuous holes in the perimeter fence.  So how many PhDs does it take to mend a barbed wire fence?  Turns out one and a half will get it done.

Dr. Morgan Ernest deftly handling some baling wire for fence repair

Dr. Morgan Ernest deftly handling some baling wire for fence repair

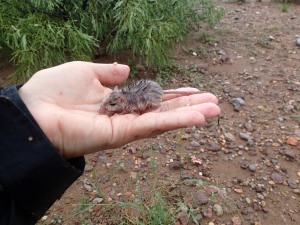
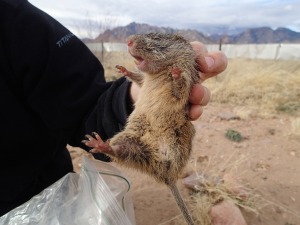
The cow wasn’t the only unexpected herbivore we encountered during the March rodent census.  Caught in one of the traps, seen for the first time on the site since 2009, was a tawny-bellied cotton rat (Sigmodon fulviventer).  Three species of cotton rat have been recorded at the site (S. fulviventer, S. hispidus, and S. ochrognathus), all of which prefer grass-dominated habitat to shrub-dominated.  They have been uncommon but persistent at Portal since its inception in 1977, and were even fairly abundant when the area was dominated by lush grasses in the mid to late 2000s.  However recent years have seen decreased rainfall and therefore the plots have been more characteristic of shrubland than grassland, and the Sigmodons moved elsewhere.  Does the return of the cotton rat mean a return to grassland is on the horizon?

S. fulviventer wasn't as excited to see me as I was to see him

S. fulviventer wasn’t as excited to see me as I was to see him